Detailed Financial Review
Critical accounting policies
The Group's significant accounting policies are set out in Note 1 to the Financial Statements.
Preparation of the consolidated financial statements requires Directors to make estimates and assumptions that affect the reported amounts in the consolidated financial statements and accompanying notes. Actual outcomes could differ from those estimated.
The Directors believe that the accounting policies discussed below represent those which require the greatest exercise of judgement. The Directors have used their best judgement in determining the estimates and assumptions used in these areas but a different set of judgements could result in material changes to our reported results. The discussion below should be read in conjunction with the full statement of accounting policies, set out in Note 1 to the Financial Statements.
Property, plant and equipment
Rental fleet accounts for around 93% (£699 million) of the net book value of property, plant and equipment used in our business; equipment in the rental fleet is typically depreciated over a period between 8 and 10 years. The annual depreciation charge relates to the estimated service lives allocated to each class of asset. Asset lives are reviewed regularly and changed if necessary to reflect current thinking on their remaining lives in light of technological change, prospective economic utilisation and the physical condition of the assets.
Intangible assets
In accordance with IFRS 3 'Business Combinations', goodwill arising on acquisition of assets and subsidiaries is capitalised and included in intangible assets. IFRS 3 also requires the identification of other acquired intangible assets. The techniques used to value these intangible assets are in line with internationally used models but do require the use of estimates and forecasts which may differ from actual outcomes. Future results are impacted by the amortisation period adopted for these items and, potentially, by any differences between forecast and actual outcomes related to individual intangible assets. The amortisation charge for intangible assets in 2008 was £1.9 million (2007: £1.6 million). Included in this charge was £1.6 million related to the amortisation of intangible assets arising from the GE-ER and Power Plus acquisitions (2007: £1.3 million).
Goodwill of £53.0 million (2007: £38.0 million) is not amortised, but is tested annually for impairment and carried at cost less accumulated impairment losses. The impairment review calculations require the use of forecasts related to the future profitability and cash generating ability of the acquired assets.
Pensions
Pension arrangements for our employees vary, depending on best practice and regulation in each country. The Group operates a defined benefit scheme for UK employees, which was closed to new employees joining the Group after 1 April 2002; most of the other schemes in operation around the world are varieties of defined contribution schemes.
Under IAS 19: 'Employee Benefits', Aggreko has recognised a pre tax pension deficit of £8.0 million at 31 December 2008 (2007: £8.1 million) with the lower than expected returns on Scheme assets offset by additional contributions made by the Company during the year of £4.0 million in line with the Recovery Plan for the Scheme agreed after the actuarial valuation at 31 December 2005.
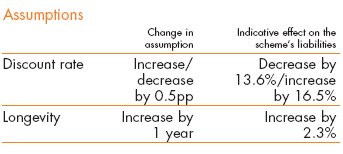
The main assumptions used in the IAS 19 valuation for the previous two years are shown in Note 27 of the Accounts. The sensitivities regarding the discount rate and longevity assumptions are shown in the table below.

Taxation
Aggreko's tax charge is based on the profit for the year and tax rates in force at the balance sheet date. Estimation of the tax charge requires an assessment to be made of the potential tax treatment of certain items which will only be resolved once finally agreed with the relevant tax authorities.
Trade receivables
Trade receivables are stated at their nominal value as reduced by appropriate allowances for estimated irrecoverable amounts. An allowance is recorded for the difference between the carrying amount and the recoverable amount where there is objective evidence that the Group will not be able to collect all amounts due. Significant financial difficulties of the debtor, probability that the debtor will enter bankruptcy or financial reorganisation and default, or large and old outstanding balances are considered indicators that the trade receivable is impaired. When a trade receivable is uncollectible it is written off against the allowance account for trade receivables.
Currency translation
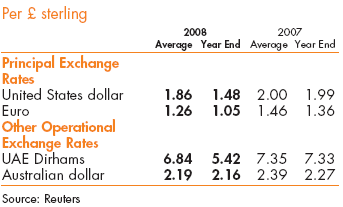
The volatility of exchange rates during the year had a material impact on the results of the Group with revenue and trading profit increasing by £57.1 million and £12.8 million respectively. Currency translation also gave rise to a £99.0 million increase in net assets as a result of year on year movements in the exchange rates. Set out in the table below are the principal exchange rates affecting the Group's overseas profits and net assets.

Interest
The net interest charge for the year was £14.8 million, an increase of £3.1 million on 2007, reflecting the higher level of average net debt during the year. Interest cover, measured on an EBIT basis, remains strong and increased to 13.9 times from 11.7 times in 2007.
Effective tax rate
The effective tax rate for the full year is 35.4% and is in line with the prior year.
Dividends
If the proposed final dividend of 6.28 pence is agreed by shareholders, it will result in a full year dividend of 10.08 pence per ordinary share, giving dividend cover of 4.54 times (2007: 3.76 times).
Cashflow
The net cash inflow from operations during the year totalled £276.1 million (2007: £230.2 million). This funded capital expenditure of £265.2 million, which was £84.6 million higher than in 2007. Net debt at 31 December 2008 was £161.4 million higher than the previous year; £77.0 million of this increase was as a consequence of currency movements, and the major part of the balance was due to increased levels of capital investment. As a result of the increase in net debt, gearing (net debt as a percentage of equity) at 31 December 2008 increased to 78% from 69% at 31 December 2007 while net debt to EBITDA increased to 1.13x (2007: 0.88x).
A working capital outflow of £48.3 million in the year was largely driven by the rapid growth of the business. In terms of the elements of working capital, inventory balances grew slightly ahead of quarter four revenue, on a constant currency basis, reflecting the growth in projects sites of our International Power Projects business, along with increased inventory at our Manufacturing facility in Dumbarton in preparation for our planned 2009 build activity. Accounts receivable balances also grew slightly ahead of revenue; at the year end, Group debtor days were 63, as opposed to 60 for the prior year. Accounts payables also grew ahead of revenue reflecting activity levels at our Manufacturing facility.
Net operating assets
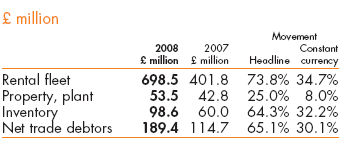
The net operating assets of the Group (including goodwill) at 31 December 2008 totalled £951.8 million, up £397.8 million on 2007. The main components of net operating assets are:

A key measure of Aggreko's performance is the return (expressed as operating profit) generated from average net operating assets (ROCE). We calculate the average net operating assets for a period by taking the average of the net operating assets as at 1 January, 30 June and 31 December; this is the basis on which we report our calculations of ROCE. The average net operating assets in 2008 were £719.4 million, up 41.4% on 2007. In 2008 the ROCE increased to 28.5% compared with 26.7% in 2007. A geographic analysis of our returns on net operating assets is set out in the table below:

Acquisition of Power Plus Rentals
On 19 August 2008 the Group acquired substantially all the assets and business of Power Plus. The purchase consideration, paid in cash, comprises a fixed element of CN$31.0 million (£15.9 million) and further payments of up to a maximum of CN$7.7 million (£4.0 million) dependent on financial performance over the next three years. The fair value of net assets acquired was £10.5 million resulting in goodwill of £5.4 million.
Shareholders' equity
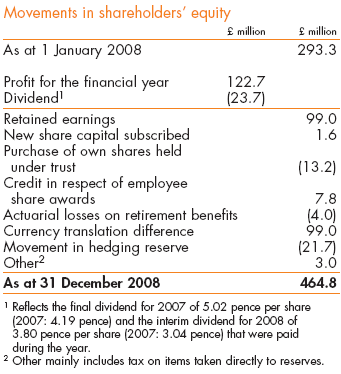
Shareholders' equity increased by £171.5 million to £464.8 million, represented by the net assets of the Group of £828.8 million before net debt of £364.0 million. The movements in shareholders' equity are analysed in the table below:

The £122.7 million of post-tax profit in the year represents a return of 26.4% on shareholders' equity (2007: 27.5%).
Treasury
The Group's operations expose it to a variety of financial risks that include liquidity, the effects of changes in foreign currency exchange rates, interest rates, and credit risk. The Group has a centralised treasury operation whose primary role is to ensure that adequate liquidity is available to meet the Group's funding requirements as they arise, and that financial risk arising from the Group's underlying operations is effectively identified and managed.
The treasury operations are conducted in accordance with policies and procedures approved by the Board and are reviewed annually. Financial instruments are only executed for hedging purposes, and transactions that are speculative in nature are expressly forbidden. Monthly reports are provided to senior management and treasury operations are subject to periodic internal and external review.
Capital management
The Group's objective with respect to managing capital is to maintain a balance sheet structure that is efficient in terms of providing long term returns to shareholders and one that safeguards the Group's financial position through economic cycles. If appropriate, the Group can choose to adjust its capital structure by varying the amount of dividends paid to shareholders, by returning capital to shareholders, by issuing new shares, or by adjusting the level of capital expenditure.
Liquidity and funding
The Group maintains sufficient facilities to meet its normal funding requirements over the medium term. These facilities are primarily in the form of committed bank facilities totalling £510.4 million at 31 December 2008, arranged on a bilateral basis with a number of international banks. The financial covenants attached to these facilities are that operating profit should be no less than 3 times interest and net debt should be no more than 3 times EBITDA. The Group does not consider that these covenants are restrictive to its operations. Since the year end the Group has refinanced or replaced £158.9 million of facilities due to mature in September 2009 with new facilities totalling £195.0 million. The maturity profile of the borrowings is detailed in Note 17 in the Financial Statements with the next maturity not due until 2011. The facilities now in place are currently anticipated to be ample for meeting the Group's requirements for the foreseeable future.
Net debt amounted to £364.0 million at 31 December 2008 and at that date un-drawn committed facilities were £141.1 million.
Interest rate risk
The Group's policy is to minimise the exposure to interest rates by ensuring an appropriate balance of fixed and floating rates. The Group's primary funding is at floating rates through its bank facilities. In order to manage the associated interest rate risk, the Group uses interest rate swaps to vary the mix of fixed and floating rates. At 31 December 2008, £227.5 million of the net debt of £364.0 million was at fixed rates of interest resulting in a fixed to floating rate net debt ratio of 63:37.
Foreign exchange risk
The Group is subject to currency exposure on the translation of its net investments in overseas subsidiaries into Sterling. In order to reduce the currency risk arising, the Group uses direct borrowings in the same currency as those investments. Group borrowings are predominantly drawn down in the principal currencies used by the Group, namely US Dollar, Euro, Sterling and Canadian Dollar.
The Group manages its currency flows to minimise foreign exchange risk arising on transactions denominated in foreign currencies and uses forward contracts, where appropriate, in order to hedge net currency flows.
Credit risk
Cash deposits and other financial instruments give rise to credit risk on amounts due from counterparties. The Group manages this risk by limiting the aggregate amounts and their duration depending on external credit ratings of the relevant counterparty. In the case of financial assets exposed to credit risk, the carrying amount in the balance sheet, net of any applicable provision for loss, represents the amount exposed to credit risk.
Management of trade receivables
The management of trade receivables is the responsibility of the operating units, although they report monthly to Group on debtor days, debtor ageing and significant outstanding debts. At an operating unit level a credit rating is normally established for each customer based on ratings from external agencies. Where no ratings are available, cash in advance payment terms are often established for new customers. Credit limits are reviewed on a regular basis. Some of the contracts undertaken in our International Power Projects business are substantial, and are in jurisdictions where payment practices can be unpredictable. The Group monitors the risk profile and debtor position of all such contracts regularly, and deploys a variety of techniques to mitigate the risks of delayed or non-payment; these include securing advance payments, bank guarantees and various types of insurance. On the largest contracts, all such arrangements are approved at Group level. Contracts are reviewed on a case by case basis to determine the customer and country risk.
Insurance
The Group operates a policy of buying cover against the material risks the business faces, where it is possible to purchase such cover on reasonable terms. Where this is not possible, or where the risks would not have a material impact on the Group as a whole, we self-insure.
Shareholder information
Our website can be accessed at www.aggreko.com. This contains a large amount of information about our business, including a range of charts and data, which can be downloaded for easy analysis. The website also carries copies of recent investor presentations, as well as Stock Exchange announcements.

